
In the early 2000s, the turbine oil industry convicted the wrong suspect. Gas turbines had challenges starting, servo valves stuck, last-chance filters loaded up with soft brown deposit and units tripped as bearing temperatures increased. The timing pointed at one change that had coincidentally occurred around the same time. Formulations of turbine and other industrial lubricants had shifted froom API Group I to Group II base stocks. Unfortunately, the varnish arrived around the same time, and the industry decided the new base oils were the cause of all their challenges.
The case looked airtight, supported by industry literature. General Electric’s technical information letter 1528-3 stated that Group II base oils are more susceptible to varnish once degradation has begun. A 2008 article in the Society of Tribologists and Lubrication Engineers’ Triboloty and Lubrication Technology put it plainly — because of their purity, Group II oils are much poorer solvents, so oxidation byproducts drop out of solution more easily. Even electrostatic discharge got pinned on them, after John Duchowski of Hydac International showed Group II oils ran well below the 500 picosiemens per meter conductivity level that he considered safe. Higher purity, lower solubility, lower conductivity, more varnish. A tidy story, signed by names everyone trusted.
The problem was, it wasn’t true. Varnish in that era came from several places at once, and most of them had nothing to do with which base oil group was in the sump. The thermal load on the oil had climbed, with smaller reservoirs and hotter running temperatures. Gas turbine designs were combining the bearing oil and the control oil into a single system, asking that oil to work in tight-clearance inlet guide vane actuators where the smallest deposit reduces response time.
Duty cycles had shifted from steady baseload to peaking and cycling, which stresses the oil harder. And the additive chemistry had moved toward amine-centric formulations, some of which, like phenyl-alpha-napthylamines, are known to produce significant deposits. The base oil change happened to land in the middle of all of it, so the base oil took the blame.
The way to settle an argument like this is to run the oils, not to reason about them. That is why Fluitec developed the Turbine Oil Performance Prediction test, which stresses a sample at 120 degrees Celsius for 12 weeks with air and metal catalysts, pulling samples at weeks three, six, nine and 12 to measure the deposits that develop. The result defied the accusations. No Group I oil has finished the 12-week version of the test.
Every Group I formulation produced significant deposits along the way. Group II and III formulated products produced drastically better deposit control performance. The fluid that the industry put on trial turned out to be the upgrade that has stretched turbine oil life over the last 25 years.
The same test makes a second point that is easy to miss. Forty-three commercially available turbine oils were tested through twelve weeks and the glassware for each were lined up at the end. The variations across the spread were enormous, even though every one of them meets OEM approvals. Oils formulated with Group II and with Group III base oils ranked among the cleanest and dirtiest, demonstrating that API group was not a key factor. The science of a low-varnish turbine oil reaches well past which API Group base oil the formulator started from. Average oils today are also markedly better than they were two decades ago. There have been positive improvements in oxidative stability and in deposit tendency both, which is its own evidence that the field learned something real once it stopped blaming the base stock.
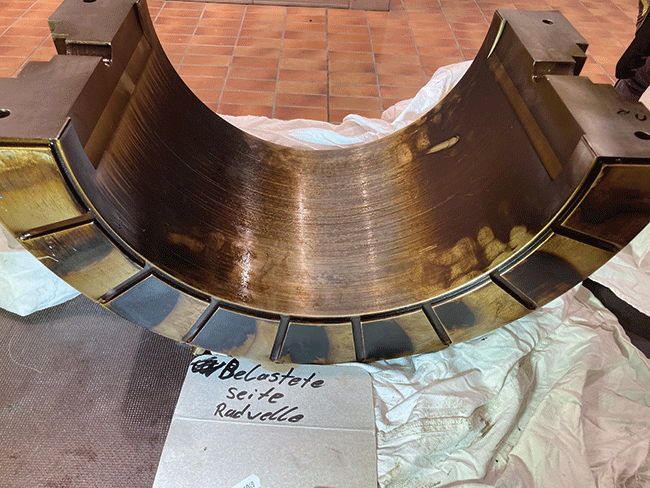
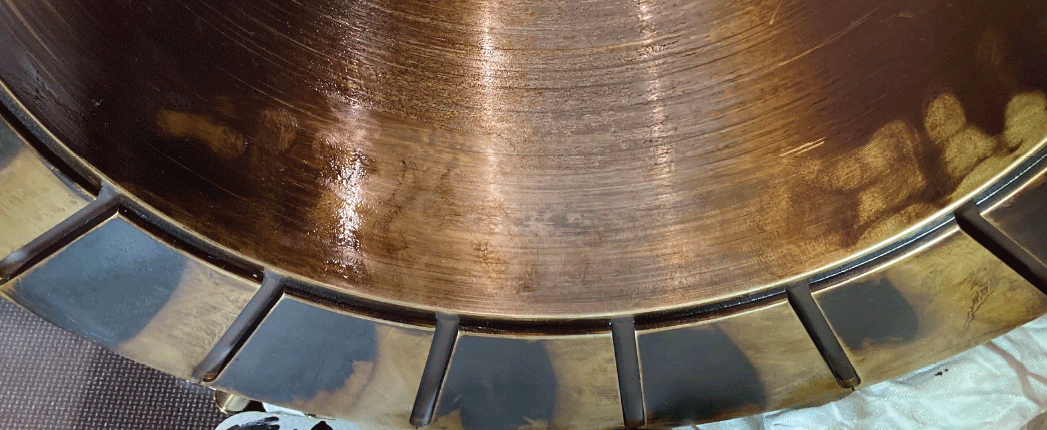
Oil deposits and varnish on gas turbine thrust bearing.
Wrong About What Varnish Even Was
The deeper correction was not about which base oil. It was about what varnish is. In 2000, the working assumption was that oil degradation products were submicron particles, and that a fine enough filter would solve the problem. There were three things that assumption could not explain. The first was that deposits often showed up on the cooler surfaces, on guide vane valves and as bathtub rings in the reservoir, not areas where particles should have collected. Secondly, test results drifted as a sample sat on the bench, which is not the nature of what particles do. Thirdly, submicron filtration simply did not pull the degradation products out of hot oil. The pieces did not fit because the model was wrong.
What the industry understands now is that most oil degradation products are soluble, and that they move in and out of solution based on temperature as easily as sugar in coffee as it goes from piping hot to frigid cold. Borrowing Hansen Solubility Parameters from the coatings and chemistry world gave the field a way to predict what will dissolve in a given oil and what will fall out, the kind of cross-domain borrowing that leads to innovation.
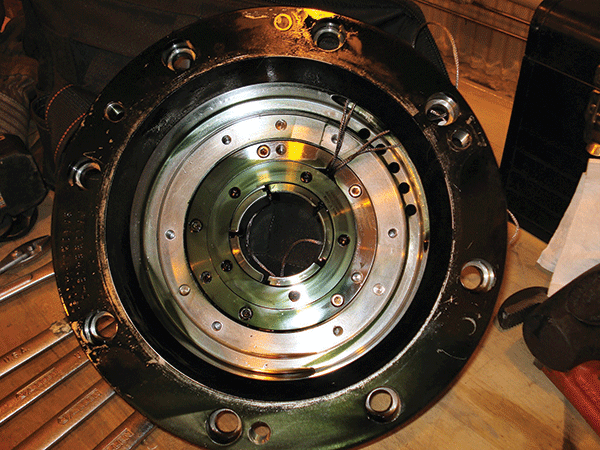
Oil deposits and varnish on rotor bearing.
Once varnish was understood as a solubility problem rather than a particle problem, new solutions were invented. Filtration gave way to chemical treatment. Resin systems that pull dissolved degradation products straight out of the oil are now the tool of choice, and solubility enhancers are widely used both to clean a system between oil changes and to increase the deposit control out of an aging oil. The industry had spent years filtering for a particle that was actually in solution.
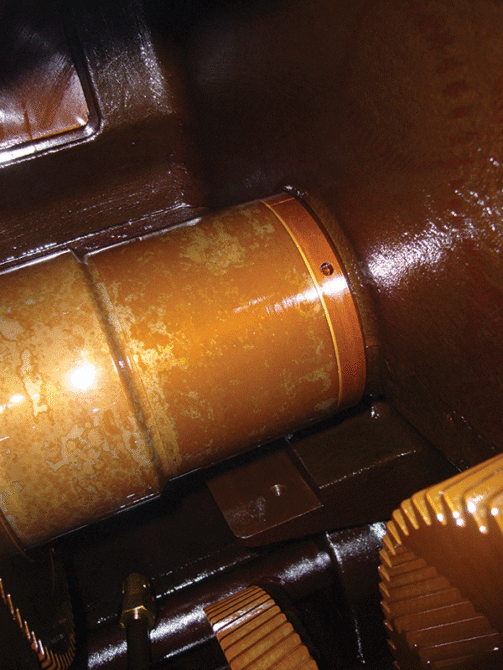
Oil deposits and varnish on turbine shaft.
None of this was possible without measurement, and measurement has its own turn in the story. In the early 2000s, no standard varnish test existed. Operators were guessing whether a unit would trip on deposits, based on oil color and experience and not much else. ASTM opened the subcommittee in 2006 and published the membrane patch colorimetry method, D7843, in 2012. That test changed the industry. For the first time we could put a number on varnish potential and compare oils, applications and trends on the same scale.
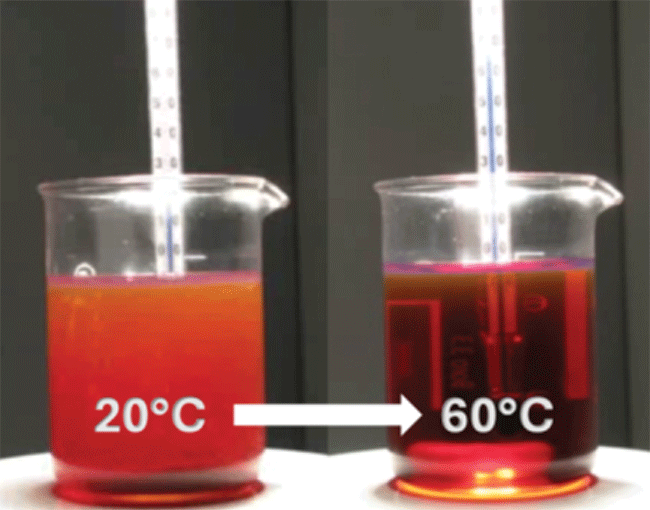
Visual changes in turbine oil transparency when the sample is heated, illustrating how oil degradation products go into solution at operating temperature.
A good number invites a familiar mistake, which is to treat it as the whole disease. MPC measures the color bodies suspended in the bulk oil. It is an excellent tool for the varnish that forms in the cool zones and blind to the varnish that forms under load at a bearing. Those bearing deposits are a different animal, sometimes called hot varnish, and they develop because of shear. We now know that the oil film in a loaded journal or thrust bearing generates internal friction producing temperatures far higher than what was previously assumed.
This is a high enough localized temperature to cook the deposits directly onto the bearing surface, yet leaves little evidence behind in the bulk oil. Pulling an oil sample on a machine suffering from shear-stress deposits may still show a low MPC while the bearing is in trouble. Hence the MPC value is not the be all and end all number.
The bearing does leave a signature, just not in the lab report. The tell is thermal. A sawtooth climb in bearing temperature or vibration signature is the classic mark of shear stress deposits, and these tools will catch it long before oil analysis does. The harder lesson from the latest bearing research is how little deposit it takes to upset the system. A layer only a fraction of the bearing clearance can cut the minimum oil film roughly in half and start to push the rotor toward instability. From there it feeds itself. A little deposit thins the oil film, the thinner film runs less stable and hotter, the heat degrades the oil faster, and faster degradation lays down more deposit. The cycle does not stop on its own.
The Same Mistake in Other Machines
But jumping to the wrong conclusion or assuming correlation is the same as causation isn’t just a varnish problem. White etching cracks tore through the wind industry’s gearbox bearings, with raceways failing in as little as six to 24 months against a 20-year design. For more than a decade, the lubricant took the blame here too. The suspects in this case were aggressive antiwear and extreme-pressure additives, sulfur chemistry and water in the oil creating hydrogen that embrittled the steel. Gear oils were reformulated and got inconsistent results — because the oil was one of the conditions inside a larger system rather than the cause.
The driver that mattered most in a great many field failures turned out to be electrical. Stray currents from the wind turbine’s frequency converter were passing through the bearing. The bench data showed that in the greater the amount of current crossing the contact, the faster it failed. The lubrication people studied the oil because the oil was the part they could measure. The bigger lever was in the electrical drivetrain, which belonged to a different department.
The Morton Effect tells the same story in rotating equipment. A compressor comes up to speed, the vibration climbs, the crew pulls the rotor and balances it and the machine runs without issues for a while before the vibration creeps back. Everything points to unbalance, so it gets balanced again and again. However, the cause is heat. Uneven heating around the journal bows the shaft a few microns, the bow shifts the heavy spot, the new heavy spot changes the heating and the loop feeds itself. Balancing keeps treating a symptom that the loop keeps remaking. The answer lay in the coupling between bearing heat and shaft dynamics, which no balancing procedure was designed to find.
Varnish, white etching cracks and the Morton Effect. Three different failures, three different specialties, one reflex underneath. The symptom showed up where the team was already looking, and the cause was sitting somewhere they weren’t.
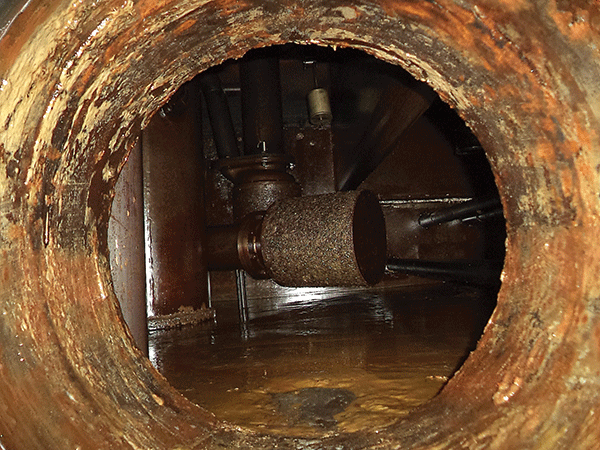
The mechanism for deposit buildup varies in different areas of the turbine lubrication system. In oil reservoirs, deposits collect on surfaces because they come out of solution at lower temperatures. Here, severe pump components with severe deposits are seen from inside oil tank.
Anyone watching artificial intelligence right now is watching a feedback loop this business will never have. A large language model that led the field six months ago is already old news, because trying an idea costs a training run and being wrong costs a benchmark score. Ideas get tested and thrown out in weeks.
Turbine oil runs on a clock the equipment sets. A wrong belief about a bearing does not correct itself on a screen. It waits for the next overhaul, maybe five or six years out, when somebody finally pulls the part and sees what the trend chart could not show. Standardizing the MPC test took six years on its own. The cross-domain failures are slower still, not because anyone is lazy, but because they only get solved when two specialties compare notes, and the chemist, the electrical engineer and the rotor dynamics specialist rarely sit at the same table or answer to the same budget. The fix waits on two fields noticing they are looking at the same machine.
Twenty-five years of studying varnish leaves the industry a far better toolkit: standard tests, soluble-phase chemistry, resin treatment and bearing models that show what the oil cannot. The more useful inheritance is a habit of doubt. Every confident varnish story along the way was built on a real correlation, and many of them were wrong about the cause. The fluid that got blamed was the better fluid. The particle everyone filtered for was in solution. The bearing that read clean was failing.
The next problem will arrive with its own tidy narrative and its own trustworthy names attached, and the only real defense is to keep asking whether the thing that moves with the failure is causing it or is it just the easiest thing to see? Correlation still isn’t causation. The industry has gotten faster at remembering that, though only a little.
By Greg Livingstone, Jo Ameye and Sanya Mathura