For the past decade, the lubricants industry has worked to develop standardized methods for measuring carbon footprints of its operations and the products it makes.
Now officials with two European grease producers have released a study containing calculations of carbon footprints for actual batches of grease. The results provide a sense of carbon dioxide levels generated by the production of these semi-fluid lubricants, according to George Dodos, technical director of Eldon’s S.A., a grease producer in Nea Chalkidona, Greece, who presented the findings in January at the International Colloquium on Tribology in Ostfildern, Germany.
Dodos and the rest of the study team — Eldon’s Chemical Engineer Andreas Dodos and Mehdi Fathi-Najafi, a senior technical advisor with Nynashamn, Sweden-based naphthenic base oil refiner Nynas AB — said the results also point to the main factors affecting grease carbon footprints. The main findings are that raw materials account for most of cradle-to-gate CO2 emissions and that choice of thickener can make a significant difference.
Accounting for Formulation Differences
In 2019, Eldon’s, Nynas and grease manufacturing equipment maker Stratco conducted another study that found CO2 emisssions related to manufacturing could be reduced by 50% by using a blend of naphthenic and paraffinic base stocks and an enclosed, pressurized grease kettle instead of straight paraffinic base stock and an open kettle.
The purpose of the new study was to dig deeper into grease carbon product footprints and the factors affecting them. In this case, the group had 11 test batches of grease produced at an Eldon’s factory. (See Fig. 1.) Five contained blends of naphthenic and paraffinic base oil, and five more contained naphthenic oil blended with rerefined paraffinic oil. The eleventh was made with ester base stock. Three of the batches were made with conventional lithium soap thickeners and four each with lithium complex and lithium-calcium thickeners. To limit the number of variables, none of the batches contained chemical additives.
Figure 1. Grease Types Considered
(11 full-scale test batches)
Batch # | Thickener Type | Base Oil Type | Viscosity (ISO VG) | NLGI Grade |
|---|---|---|---|---|
TB1 | Lithium complex | Naphthenic + paraffinic | 150 | 2 |
TB2 | Lithium-calcium | Naphthenic + paraffinic rerefined | 150 | 2 |
TB3 | Lithium complex | Naphthenic + paraffinic rerefined | 220 | 2 |
TB4 | Lithium-calcium | Naphthenic + paraffinic | 220 | 2 |
TB5 | Lithium complex | Naphthenic + paraffinic rerefined | 150 | 2 |
TB6 | Lithium complex | Naphthenic + paraffinic | 220 | 2 |
TB7 | Lithium-calcium | Naphthenic + paraffinic | 150 | 2 |
TB8 | Lithium-calcium | Naphthenic + paraffinic rerefined | 220 | 2 |
TB9 | Conventional lithium | Naphthenic + paraffinic | 220 | 2 |
TB10 | Conventional lithium | Ester | 320 | 2 |
TB11 | Conventional lithium | Naphthenic + paraffinic rerefined | 46 | 00 |
Complex lithium thickeners are usually required at higher concentrations than conventional lithium, so levels in the test batches varied — from 7% for one of the conventional lithium batches to 12.9% for one containing complex lithium.
There were other variations both in the make-up of the greases and their physical characteristics. Viscosities of the base oils used varied significantly — from 20 centiStokes at 100 degrees C for the naphthenic oil to 10 cSt for the virgin paraffinic and 5.5 cSt for the rerefined oil. Viscosities of the grease batches varied, therefore, with the proportions of the base oil blends. For example, batches in which rerefined oil constituted 10% of the base oil had viscosity grades of ISO 220, while those with 15% rerefined oil were ISO 150. Batch 11 had significantly more rerefined oil and was ISO 46.
For this study the trio estimated cradle-to-gate footprints, which cover all activities associated with the production and transportation of raw materials to the production site, along with emissions generated by activities involved in production, stopping at the factory gate, when the packaged product is prepared for transportation downstream. (See Fig. 2.) Upstream packaging for materials coming to the manufacturing site were included but not downstream packaging other than metal drums.
Figure 2. Process Methodology
Included (if not excluded due to cut-off criteria) | Excluded |
|---|---|
Production-related raw materials | Production of capital goods |
Fuel and energy-related utilities (electricity, steam, natural gas, biomethane, oil, etc.) | Business travel or employee commuting |
Direct emissions from manufacturing | Services such as enginneering or infrastructure services, R&D activities |
Other utilities consumed (process water, inert gas, etc.) | Downstream transportation |
Production losses and treatment of waste and wastewater | Downstream packaging |
Upstream transportation | |
Upstream packaging |
Standardized and Measure Data
The study team used a variety of methods to estimate the carbon footprints for these batches. Contributions for raw materials and other inputs upstream of the manufacturing site are referred to collectively as the feedprint. For these the trio used emissions data from supplier sources, such as standard numbers from the International Lithium Association for lithium hydroxide and from the Castor Seed Association for fatty acids, most of which come from castor oil. Corresponding numbers are available for virgin and rerefined base stocks. Dodos noted that raw material feedprints would be affected by distances transported to the grease factory (in the form of fuel consumed for transportation). The study assumed transportation distances were all equal.
Emissions generated on-site were calculated by averaging annual energy consumption. The study group included energy used to move materials around the manufacturing site; electricity consumed for warehouse movement and tank pumping; energy consumed for grease cooking and grease finishing.
Of all of the sources covered by the study’s calculations, raw materials were the largest part of the cradle-to-gate carbon footprints, accounting for example for 67% of emissions for Test Batch 9. (See Fig. 4.) Product packaging — the study group assumed all batches were packaged into 180-kilogram steel drums — were the next largest generator at 12.9%, followed by upstream packaging at 11%, handling at 4.2% and heating for grease production at 3.5%. Other electricity used in production accounted for just 1.1% of overall emissions.
Figure 4. Normalized CO2 Emissions
(kg of CO2 emissions/kg)

There are several significant variables to raw material feedprint, Dodos said. Use of rerefined paraffinic base oil can lower emissions compared to virgin paraffinic. That’s no surprise, since producers of rerefined oil generally claim to have footprints that are 60%-80% below those for virgin base oils.
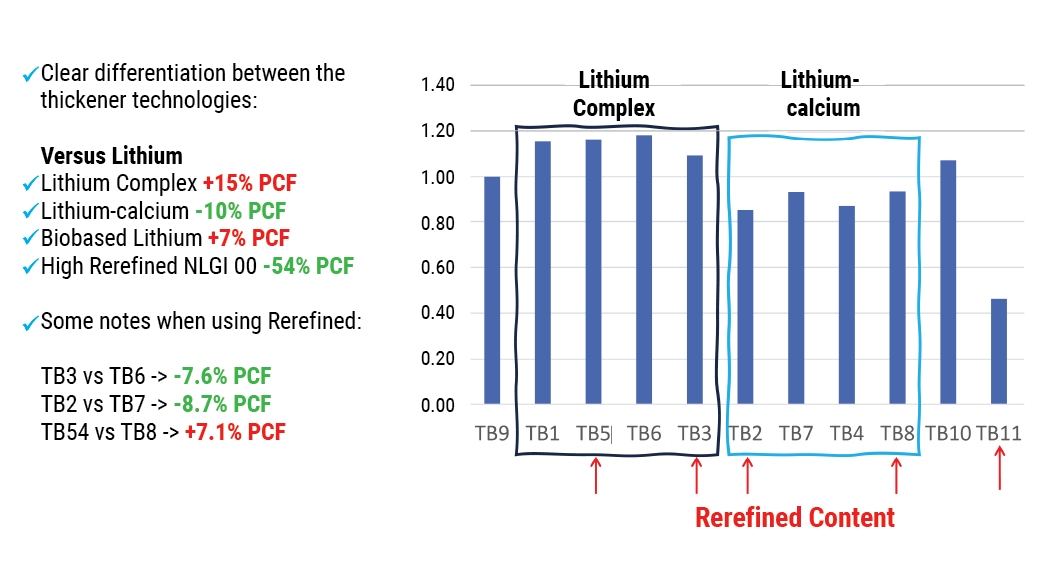
Dodos emphasized, however, that the savings from use of rerefined stocks is not completely predictable. (See Fig. 5.) Batches 3 and 6 both used lithium complex thickeners and were ISO 220 viscosity grade, but the base oil in Batch 3 was a blend of naphthenic and rerefined oil, whereas Batch 6 blended naphthenic with virgin paraffinic. Batch 3’s carbon footprint was 7.6% lower. Likewise, Batch 2’s was 8.7% lower than Batch 7’s, in a comparison between two ISO 150 greases made with lithium-calcium thickeners. But Batch 4’s footprint was 7.1% higher than Batch 8’s, in a comparison of lighter lithium-calcium thickened products.
Figure 5. Emissions and Findings
(kg of CO2 emissions/kg)
“This suggests that the use of rerefined base oil is more complex than it was perceived to be,” Dodos said.
Impact of Thickeners
The contribution of thickener systems also varied, and not just because of emissions involved in their production. Lithium complex has higher emissions than conventional lithium (see Fig. 3) because it requires an additional process in the manufacturing and because it must be used in higher concentrations. Conventional lithium can be used in lower concentrations and enables better yields.
Figure 3. PCF Comparison of Thickener Technologies

Lithium-calcium thickeners generate less emissions than conventional lithium because the calcium allows for less use of lithium, which is more intense in emissions generated.
“There is clear differentiation between the thickener technologies,” Dodos said. “Lithium complex has the greatest contribution,” toward emissions.
While the grease production process accounts for the smaller portion of emissions — between 5% and 10% combined — proportionately significant reductions can be achieved by optimizing the process, the study team concluded. For example, lithium complex thickeners require an additional step and longer cooking and therefore use more energy.
Dodos said the study provided a sense of the sizes of grease product carbon footprints. Ten of the batches ranged between 0.82 kilograms of CO2 emissions per kilogram of grease and 1.38 kg/kg. The 11th, the much lower viscosity grade batch with significantly higher rerefined content, had a footprint of approximately 0.45 kg/kg.
To add context, Dodos said the footprint for a kilogram of grease with a score of 0.9 kg/kg would match the impact of a Euro 6 automobile traveling about 0.3 miles. Twenty-two tons of the same grease would equate to a commercial truck traveling from Stuttgart to Athens, approximately 5,000 kilometers, and 220,000 tons of the same grease would match annual emissions from 3,863 Netherlands households.
More Work Ahead
Dodos called the study a significant step toward measuring the sustainability of greases but added that much work remains. Some industry estimates and methodologies for upstream inputs still have room to be honed, he said.
“There are a large number of parameters that are still uncertain, not least the quality of data that is being presented by inbound streams to the process,” he said. “This means that there is significant room for improvement of any value calculated by the use of practically any verified model.”
And the portion of the supply chain downstream from the grease factory gate has yet to be addressed. Estimating the use and end-of-life phases — or improving the emissions they generate — could be especially difficult for grease given that it is collected and recycled at much lower rates than liquid lubricants.
“What is ultimately needed by the industry is life-cycle analysis values for the products,” he said. “This means that product footprint as well as carbon handprint need to be measured, including the fate of the product and the end of life. This requires close collaboration with all industry stakeholders as well as downstream users.”
Tim Sullivan is Executive Editor of Lubes’n’Greases. Contact him at Tim@LubesnGreases.com