The geography, quality and scale of global base oil supply has fundamentally changed over the past two decades. Global production capacity has swollen by 50% while demand has been almost flat.
What on the surface appears to be a straightforward story of expansion turns out to be a seismic shift in supply base driven by technology, regulations and economic turbulence. Between 2005 and 2025, global mineral base oil production capacity grew from 43 million metric tons per year to 65 million t/y, including rerefined oils. Once-thriving regions of production withered while others rose to prominence with higher-quality materials from more efficient plants.
Rather than growing incrementally from the existing base, the industry has effectively rebuilt itself from within. Legacy assets have been dismantled and ever-greater volumes of modern capacity commissioned.
Lubes’n’Greases has collated global base stock plant capacity data since 2005, and this article discusses trends affecting capacity based on that data.
Shifts Between API Groups
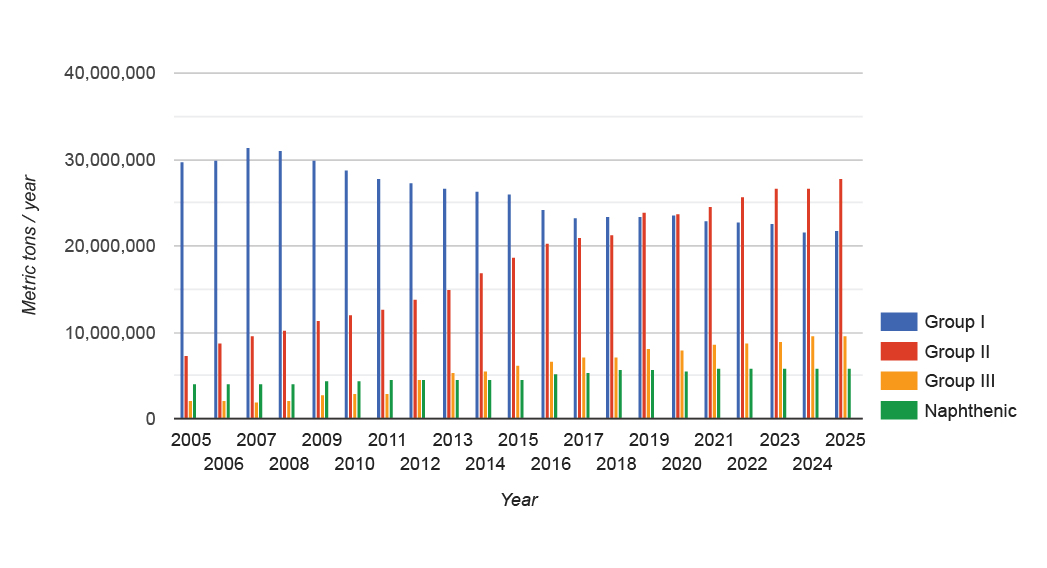
In 2005, most of the base stocks produced globally were still API Group I oils, which accounted for nearly 30 million tons of annual capacity. By 2025, capacity of this old-school grade had shrunk by more than 30% to about 22 million tons per year.
These plant closures were permanent, reflecting the declining relevance of Group I stocks — or so it seemed at the time — in the face of changing performance demands and regulatory requirements. Across all regions, once Group I capacity was closed it was not replaced by new builds, except for some debottlenecking and modest expansions in China and the Middle East.
The largest reduction in Group I capacity has been in Europe, where plants with combined capacity of 3.2 million t/y were shuttered. Aging, small-scale assets proved uneconomic to upgrade under tightening environmental regulations and evolving finished lubricant performance demands. Spain, Italy, France, Germany and the United Kingdom moved from meaningful Group I production to a partial or complete exit.
Asia and Oceania came next, closing 934,000 t/y of capacity in Australia, China, Japan and Taiwan. North America experienced a more modest contraction as closures by ExxonMobil’s Imperial Oil and Shell in Canada took 602,000 t/y offline.
By the end of the 2010s, most modern passenger car engine oil formulations had stopped including Group I base oil as a main component, although Group I is still used in monograde passenger car oils and in heavy-duty, off-highway and industrial engine oils. The International Maritime Organization’s 2020 sulfur cap, which required ships to burn low-sulfur fuel or install scrubbers, indirectly drove down Group I demand further as formulators had to use other base stocks compatible with altered combustion regimes and extended service intervals, although Group I bright stock remains important in marine and industrial applications.
Figure 1. Global Mineral Base Oil Capacity by API Group, 2005-2025
Lower yields, higher operating costs and limited feedstock choices mean Group I’s dominant market position is unlikely to be restored.
By the early 1990s, progressive development of new refining technologies — including hydrocracking, dewaxing and then wax isomerization — enabled better base stock yields and performance. The end of the decade saw Group II production in full swing in North America and Asia. After the ILSAC GF-3 passenger car engine oil specification was introduced in 2001, market acceptance was a done deal.
Group II has since emerged as the industry’s primary growth engine, with capacity rising from just over 7 million tons in 2005 to nearly 28 million tons in 2025, a 300% increase. Group II base oils now represent about 43% of global base oil production capacity.
The grade’s ascendancy reflects the market shift toward higher-performing base stocks capable of meeting modern engine and lubricant specifications. Group II is often dubbed the “workhorse grade” for its adaptability to many applications where Group I was once stalwart. Lately, Group II has found inroads into territory where Group I bright stock reigned supreme.
By 2019, Group II capacity eclipsed Group I. Meanwhile, slowly but surely, Group III capacity grew from 2 million tons in 2005 to 9.65 million in 2025. Much of this growth has been in East Asia, especially China and South Korea. Group III stocks are the foundation of many synthetic-labeled lubricants widely used in newer automobile engines and high-performance applications, particularly where emissions and fuel economy standards are stringent. They have lower viscosity and volatility profiles and are in high demand from formulators attempting to keep up with OEMs’ push for ever-lighter engine oils.
Beyond Paraffinic
Naphthenic base oil capacity increased more modestly, from slightly over 4 million t/y to nearly 6 million t/y over the same period. This gentle upward path reflects their specialized industrial and niche roles. The have very low pour points, excellent additive solubility and require fewer refining steps, which gives them a lower cost basis. Their resilient popularity in specialty applications such as electrical transformer oils, refrigeration lubricants and other industrial uses underlines the fact that base oil demand is not monolithic.
The International Energy Authority predicts peak electricity demand will rise by 40% by 2035, which should increase pale oil demand for transformer and turbine oils.
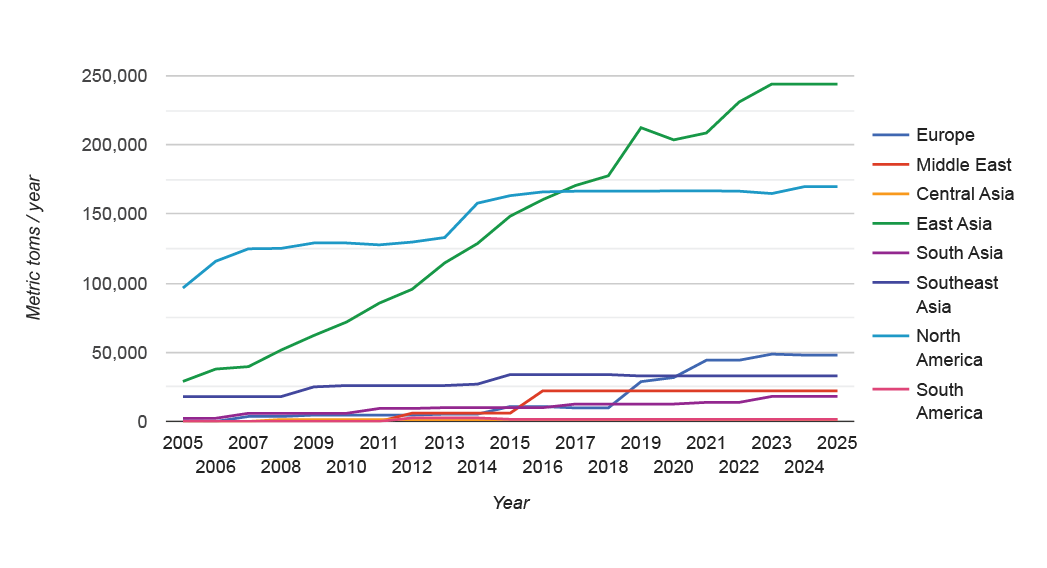
Figure 2. Group II Capacity by Region, 2005-2025
Other production methods and base stocks have made inroads into the marketplace. Shell’s gas-to-liquids joint venture plant in Qatar became the first commercial scale source of GTL base oils, and several coal-to-liquids plants — likewise based on Fischer-Tropsch technology — now operate in China. Polyalphaolefins have continued to gain traction. Rerefined base oils are gaining new momentum from the sustainability movement.
Demand and Regulation Drive Change
Taken together, roughly 30 million t/y of new capacity — overwhelmingly Group II and Group III — were added between 2005 and 2025, while nearly 8 million t/y of Group I capacity were retired. The net result was a gain of about 20 million tons and a dramatic upgrade in product quality and capital intensity.
The industry’s structural evolution is not fully explained by supply dynamics. On the demand side, major shifts in automotive technology, emissions regulations and lubricant performance expectations created a context in which higher-quality base stocks became essential rather than optional. In the late 2000s and early 2010s, passenger and commercial vehicle engines underwent rapid change. OEMs increasingly specified lower viscosity oils such as SAE 0W-20 and 5W-30 to achieve better fuel economy and meet tightening emissions targets.
These lower viscosity categories require base stocks with superior viscosity indices, oxidation stability and low-temperature properties — characteristics far more achievable with Group II and Group III base oils than Group I. Emissions regulations such as Euro 4 in 2005, Euro 5 in 2009 and later Euro 6 in 2014 imposed stringent limits on particulate matter and nitrous oxide emissions. These requirements led to the widespread adoption of exhaust aftertreatment systems, including diesel particulate filters and selective catalytic reduction.
Lubricants compatible with these systems necessitated low sulfated ash, phosphorus and sulfur (low-SAPs) formulations, which in turn demanded base stocks with lower percentages of sulfur and other impurities. These regulatory thresholds created market pull for Group II and Group III capacity, as formulators sought to balance performance with compliance.
Figure 3. Big Gets Bigger
Comparing World’s Biggest Base Oil Plants 2005, 2025
2005 | 2025 | ||||||
Company | Location | Capacity (t/y) | API Group | Company | Location | Capacity (t/y) | API Group |
Motiva | Port Arthur, Texas, U.S. | 1,248,000 | II, III | ExxonMobil | Jurong Island, Singapore | 2,525,000 | II |
S-Oil | Onsan, South Korea | 1,216,000 | I, II, III | S-Oil | Onsan, South Korea | 2,122,000 | I, II, III |
Excel Paralubes | Westlake, Louisiana, U.S. | 1,111,000 | II | Motiva | Port Arthur, Texas, U.S. | 2,017,000 | II, III |
ExxonMobil | Baytown, Texas, U.S. | 1,081,000 | I, II | Qinghe Chemical Technology | Zibo, China | 1,400,000 | II, III |
ExxonMobil | Augusta, Italy | 908,000 | I | Shandong Qingyuan | Zibo, China | 1,400,000 | II |
ExxonMobil | Jurong Island, Singapore | 901,000 | II | Shell-Qatar Petroleum | Ras Laffan, Qatar | 1,372,000 | III |
Socar | Baku, Azerbaijan | 845,000 | I | ExxonMobil | Baytown, Texas, U.S. | 1,369,000 | I, II |
SK | Ulsan, South Korea | 832,000 | II, III | GS-Caltex | Yeousu, South Korea | 1,297,000 | II, III |
ExxonMobil | Baton Rouge, Louisiana, U.S. | 830,000 | I | SK Enmove | Ulsan, South Korea | 1,267,000 | III |
Chevron | Richmond, California, U.S. | 746,000 | II | Chevron | Pascagoula, Louisiana, U.S. | 1,251,000 | II |
Regulatory frameworks extending beyond emissions also shaped base oil demand. In the European Union, implementation of Registration, Evaluation, Authorization and Restriction of Chemicals, or REACH, introduced stringent environmental and safety requirements for chemical substances, including base stocks. These regulations pushed formulators away from heavier Group I stocks that often contain higher levels of residual aromatics, reinforcing demand for “cleaner” Group II and Group III molecules.
In consumer markets, expectations changed as well. While previously shorter drain intervals ensured more product turnover, extended drain intervals emerged as a competitive advantage. Original equipment manufacturers began recommending longer drain intervals as fuel economy and total cost of ownership became key marketing points. This further increased reliance on high-performance base stocks capable of maintaining viscosity and protection over extended operating periods — another structural demand driver pushing industry capacity toward Group II and Group III.
From Supply Logic to Company Strategy
As demand drivers evolved, company behavior adapted accordingly. Traditional oil majors used the period to rationalize legacy Group I exposure while selectively reinvesting in world-scale Group II and Group III assets. ExxonMobil is a clear example of this dynamic, closing older facilities while simultaneously building large, export-oriented plants and emerging as a net capacity gainer in the process. Shell, Sinopec, PetroChina and Chevron also deployed capital toward higher-quality base stocks while managing their legacy portfolios through joint ventures and partnerships.
Concurrently, new entrants and regional specialists joined the market at scale, particularly in Asia and the Middle East. Producers such as Shandong Qingyuan, Qinghe Chemical Technology and GS Caltex built facilities optimized for the demands of modern lubricants, largely in Group II and Group III segments.
By 2025, global base oil supply risk is no longer defined by total installed capacity, but by the concentration of export-scale Group II and Group III production controlled by a relatively small number of companies. Outages or policy shifts affecting these suppliers can rapidly tighten markets far beyond their home regions.
Europe’s sharp and permanent Group I exits, followed by Japan-led rationalization in Asia and reductions in North America, illustrate how early regulating and high-cost regions absorbed the first wave of asset retirements. These closures were decisive and irreversible, and critically they were not offset by new Group I builds elsewhere. Instead, capacity growth shifted toward fewer, larger and more capital-intensive Group II and Group III projects, often commissioned as discrete world-scale additions rather than incremental expansions.
As Group I disappeared, supply became stickier and less flexible, with modern assets exhibiting longer operating lives and higher barriers to entry. Geographic diversification increased on paper, but effective control of supply concentrated around a smaller set of countries and companies, particularly those hosting export-oriented Group II and III plants.
The industry did not merely replace one base oil group with another but fundamentally restructured itself. It traded fragmentation and flexibility for scale, quality and durability, while increasing exposure to concentration risk and reducing the scope for rapid supply adjustment in the future.
The base oil industry that emerged over the past two decades is larger, more technologically advanced and more capital-intensive than its predecessor. It is also more concentrated and more exposed to strategic and regulatory disruption. While the molecules produced today are higher performing, much capacity is concentrated at very large plants — a direct consequence of demand forces rooted in automotive technological developments, emissions regulations, lubricant performance expectations and extended drain intervals.
Simon Johns is an editor with Lubes’n’Greases. Contact him at Simon@LubesnGreases.com.