
Total United States base oil production continued its climb toward pre-pandemic levels with another steady showing in the first half of this year. Production volumes, imports and exports hovered near last year’s numbers as the industry continued on the path to recovery. Meanwhile, Russia’s invasion of Ukraine heavily impacted U.S. import and export markets.
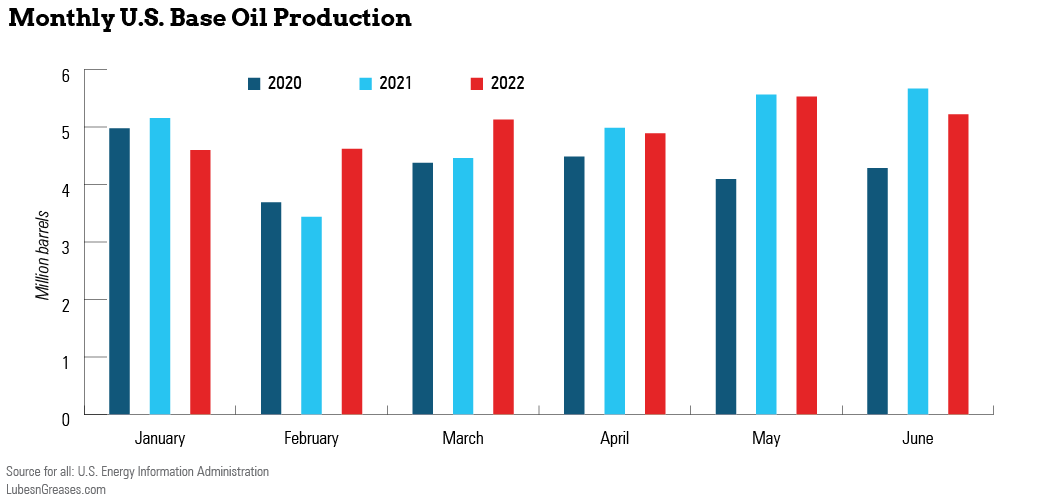
From January through June this year, the U.S. produced almost 30 million barrels of base oil—just above the 29.3 million barrels it made in the first half of 2021, according to data published by the U.S. Energy Information Administration.
“Total production has recovered from [first half 2020 levels], though it has not yet consistently reached the peak levels of the second half of 2017 through the second half of 2018,” said H. Ernest (Ernie) Henderson, president of K&E Petroleum Consulting. The U.S. produced 34.1 million barrels of base oil in the second half of 2017, 34 million the first half of 2018 and 33.3 million the second half of 2018.
The second half of 2019 hit 32 million barrels before plummeting to 26 million barrels in the first half of 2020.
First-half U.S. Base Oil Production – (000 barrels, January-June)
Paraffinic base oil production saw a slight bump in 2022 from 24.6 million barrels in the first half of 2021 to 25.3 million barrels in 2022. That number nearly matches 2017’s first-half output and eclipses 2019, when the U.S. produced 23.7 million barrels of paraffinic products. Production peaked in 2018 with 29 million barrels.
It was the same story for naphthenic output, which increased from 4.6 million barrels to 4.7 million. Comparatively, naphthenic production sat at about 5 million barrels from 2017 to 2019.
Regional Production
Minus the West Coast area, production was up across the board for the five Petroleum Administration for Defense Districts.
PADD 1, consisting of refineries along the East Coast, put out 2.2 million barrels of base oil in the first half of the year, up about 15% from 1.9 million barrels the previous period. The PADD is split between two districts: the East Coast district and Appalachian district. The former’s production rose from 900,000 barrels to 1.1 million barrels, the latter from 992,000 barrels to just under 1.1 million.
Midwest refineries, or PADD 2, increased production by 7% from 1.1 million barrels to 1.2 million barrels. All production from this PADD came from Oklahoma, Kansas and Missouri.
PADD 3, consisting of refineries along the Gulf Coast and the largest of the five PADDs, churned out 24.2 million barrels in the first six months of the year, up 5% compared to 23 million in the same period last year.
In the Texas Gulf Coast region of PADD 3, production rose 15% to 9.9 million barrels. The Louisiana Gulf Coast dropped in production by about 6% to 9.1 million.
In the smaller subsections of PADD 3, production in North Louisiana and Arkansas increased 12% from 4.6 million barrels to 5.2 million. Texas inland production hit 90,000 barrels compared to 89,000 in 2021.
PADD 5, made up of refineries along the West Coast, saw a 25% drop in production from 3.2 million barrels to 2.4 million barrels. That decrease was associated with the turnaround at Chevron’s Richmond, California, Group II and Group III refinery, which has capacity to make 21,700 barrels per day.
Imports
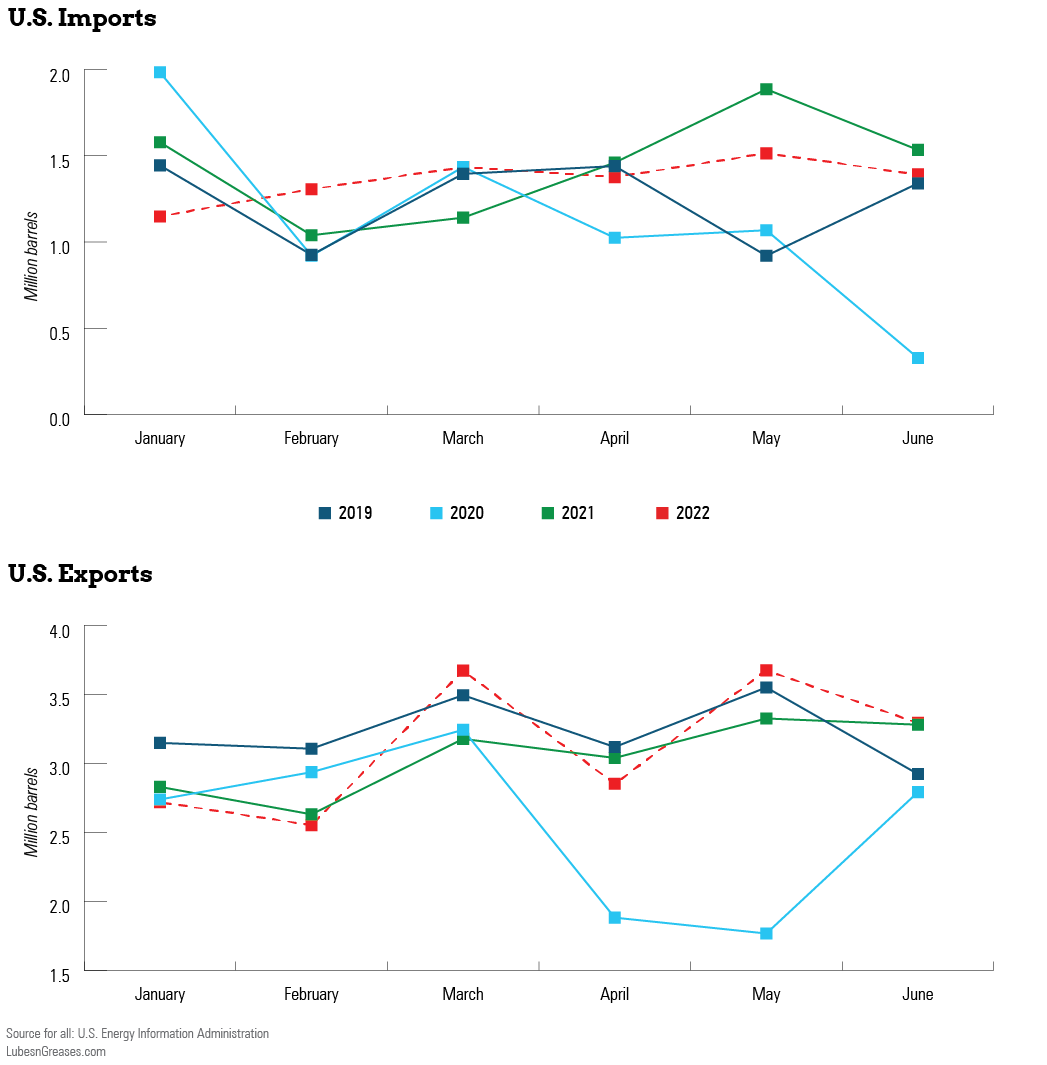
The U.S. imported 8.6 million barrels of base oil in the first six months of last year, a historic high in that category after severe cold weather in February 2021 shut down four major refineries in Texas, Louisiana and Oklahoma. This led to a greater need for base oils from outside sources.
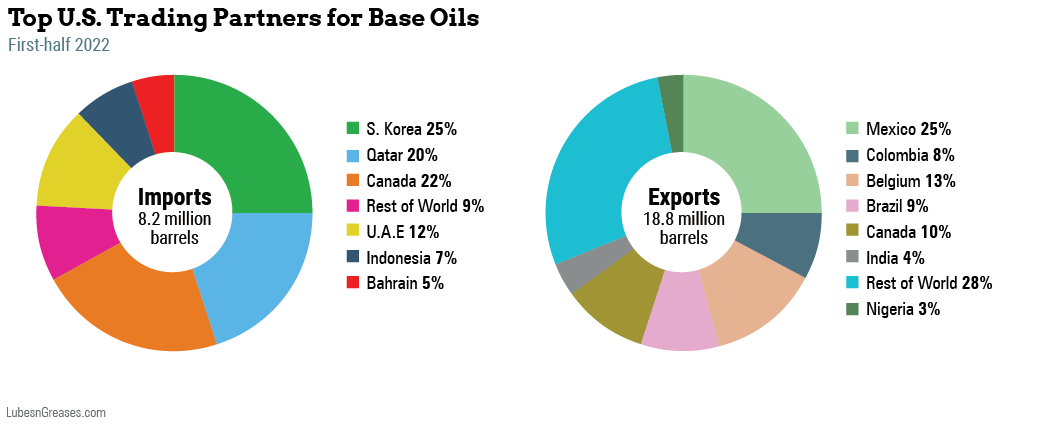
That number settled back down to 8.2 million barrels in the first half of 2022, representing a 5% dip.
The sources for those import volumes have shuffled in a year’s time. The most base oil imports in 2021 came from Qatar (2.2 million barrels), Canada (2.1 million), South Korea (1.5 million), the United Arab Emirates (811,000) and Bahrain (547,000).
In 2022, South Korea reigned supreme the first six months, with 2 million barrels sent to the U.S. Canada remained the runner-up, with 1.7 million barrels, followed by Qatar with 1.6 million barrels. The UAE again came in at fourth with 985,000 barrels, while Indonesia overtook Bahrain at 556,000.
According to import data gathered by Henderson going back five years, there are a few trends of note.
Imports from Qatar in the first half of the year have increased dramatically since the country sent just 778,000 barrels to the U.S. in 2017. That number jumped up to 1.9 million barrels the following year, and 2021’s 2.2 million-barrel output was its highest of the past five years.
Canada has shown plenty of variability, starting with 1.9 million barrels in 2017 and declining every year to its lowest point at 1.2 million barrels in 2020. It jumped back to 2.1 million barrels last year.
South Korea has been a consistent source of base oil for the U.S. Since 2017, in order, it exported 2.4 million barrels, 2.5 million barrels, 2.1 million barrels, 1.8 million barrels and 1.5 million barrels before this year’s recovery.
The UAE has seen steady growth, starting at 371,000 barrels in 2017 and rising each year, with the exception of one dip between 2018 and 2019.
Henderson noted that the UAE’s numbers are rising as ADNOC’s Group III market share grows. Additionally, while South Korean imports grew from last year to this year, the country is gradually losing share to other Group III suppliers. This is “evident when you compare with share levels in 2017 and 2018,” he said.
“Qatar remains consistent as demand for Group III from Shell has continued to maintain its number one position globally in terms of finished lube market share,” Henderson added.
Though no country in the region ranks in the top five, Henderson also observed that imports from Western Europe (Belgium, France, Finland, Germany, Italy, Netherlands, Spain, Sweden and the United Kingdom) are down from 762,000 barrels to 621,000 barrels. This is potentially related to Russia’s invasion of Ukraine and the need to consume within the region.
Imports from Russia itself have rested between 23,000 and 44,000 barrels, with one 203,000-barrel spike in 2019. That number was just 5,000 the first half of this year.
“Overall, imports have remained steady during 2021 and the first half of 2022,” Henderson said. “Imports have recovered from the lows of 2020 due to COVID and have recovered to pre-COVID (i.e. 2019) levels. Overall imports are slightly above 2017 and 2018 levels.”
In terms of share percentage of total imports, the biggest dip was experienced by South Korea, which controlled a 31% share of all U.S. imports in 2017 but now sits at about 25%. In contrast, the UAE and Qatar have seen a rise in shares. The former has gone from just under 5% in 2017 to 12% this year, the latter from 10% to 20%.
Exports
Exports trended slightly upward this year, increasing just a little under 3% to 18.8 million barrels. Similar to imports, there were some noticeable trends regarding the destination of U.S. base oil exports.
The most eye-catching change came with exports to Mexico. The country remains by far the most popular destination for U.S. base oils, but total numbers took an almost 25% dip this year to just 4.7 million barrels.
“First, I’d say U.S. Group I Bright Stock and heavy neutral exports to Mexico are being reduced based on U.S. supply tightness for these grades,” said Amy Claxton, CEO of My Energy Consulting and Training. “Supply is short, and prices are high. Barrels are being exported to the highest bidders, which may not be Mexico. Also, U.S. refiners may be sending Group I and Group II base oils to European affiliates, who no longer get Russian Group I imports due to embargo from the Ukrainian war.”
Belgium was the second-most popular destination at 2.3 million barrels, with Canada lagging behind at 1.9 million barrels and Brazil at 1.8 million barrels.
Colombia made a large leap in the volume of base oils it received from the U.S. From 610,000 barrels in 2021 to 1.4 million barrels this year, it now ranks fifth in base oil destinations.
This is likely associated with maintenance at the Group I base oil plant in Barrancabermeja, Columbia, as significant volumes were imported during the June-July period of 2022 compared to normal activity.
Claxton added it could also relate to political and economic issues in Venezuela. “Finished lubricant companies are blending in Colombia, then bringing finished lubricants into Venezuela.”
Outside the top five, exports to France rose from 33,000 barrels to 454,000 barrels. Claxton again pointed to U.S. refiners sending affiliate barrels to Western Europe to make up for an inability to secure Russian supply.
In an even bigger jump, exports to Nigeria increased from 8,000 barrels to 603,000 barrels. “Nigeria imports all its base oils and blends finished lubricants in-country,” Claxton said. “Their one refinery underperforms and doesn’t make on-spec or consistent base oils, so they’re all imported. Timing makes me think they’ve stopped importing from Russia and had to find alternative base oil supplies.”
Henderson said overall exports have remained steady in the previous three six-month periods—the first half of 2021, the second half of 2021 and the first half of this year—and are approaching pre-pandemic levels.
The U.S. sends a large number of its exports to Mexico for a few reasons. “This includes base oils to offset lack of quality production by Pemex and finished oils to support the growing original equipment manufacturer business in Mexico,” Henderson said. “This volume also includes exports of very low-viscosity base oils that has been used in the past as a diesel fuel cetane improver.”
He also noted the large portion of exports sent to Belgium and the Netherlands. This is likely supporting the supply chain of global base oil suppliers from the U.S. Gulf Coast to Rotterdam, Antwerp and Western Europe.
The U.S. is also a major source of exports to Latin and South America, where Group I base stock production is declining while demand for Group II and III grows.
Mexico’s sharp drop was notable after the U.S. sent 6.5 million barrels and 6.2 million barrels in 2019 and 2021, respectively. But according to Henderson’s data, its current total sits not far from its 2018 volume (5 million barrels) and well above its 2017 total (3 million barrels).
Belgium has remained a consistent player in U.S. exports. After receiving 1.8 million barrels in 2017, the volumes have never dipped below 2.1 million, with the peak coming at 2.6 million last year.
Canada’s 1.9 million barrels this year was a five-year spike, where U.S. exports have generally sat between 1.5 million and 1.6 million, excluding 2020.
Exports to Brazil (2.1 million barrels) marked a five-year high, with this year’s number of 1.8 million sitting generally within range of that period, sans 2020.
As mentioned, Colombia’s 1.4 million barrels was a sizeable increase. Exports to the South American country sat between 466,000 and 770,000 barrels in the years prior.
In terms of share percentage, Mexico’s fall took it from a 34% share in 2021 to a 25% share this year, though this year’s share by far outpaces the largest share from any other country in the past five years.
Other big players—Belgium, Canada and Brazil—remained consistent.
Will Beverina is assistant editor for Lubes’n’Greases. Contact him at Will@LubesnGreases.com